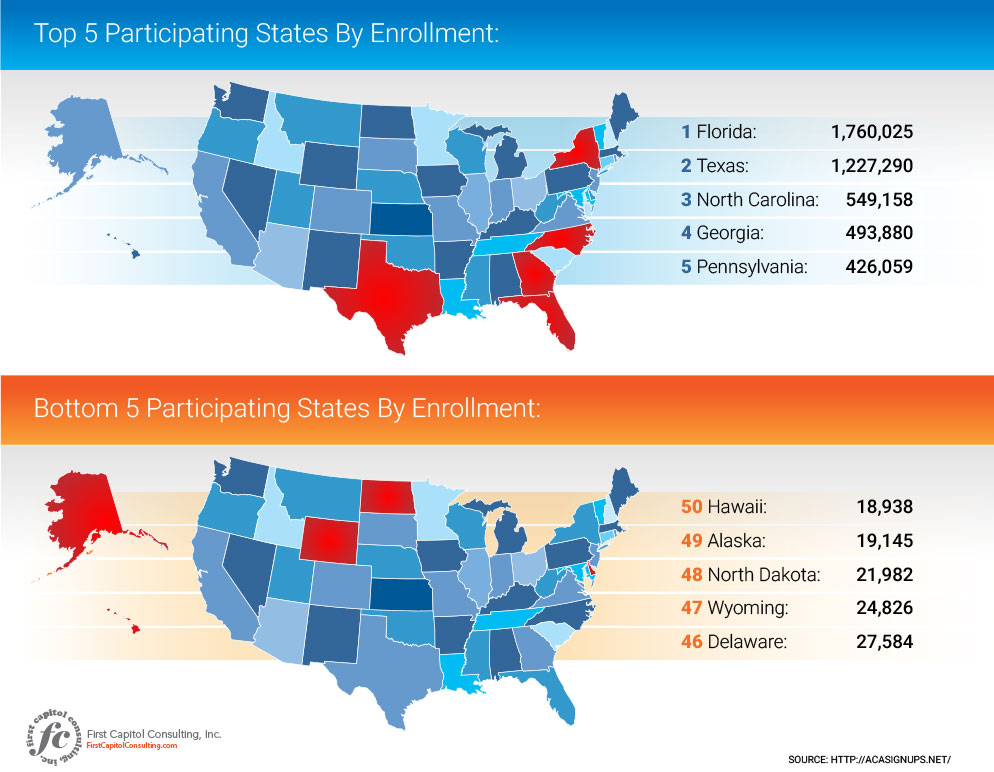
From November 1, 2016 through January 31, 2017, Healthcare.gov launched its open enrollment period for new and returning consumers to obtain coverage through the Health Insurance Marketplace. Our infographic shows the final figures, though several changes in the political system contributed to the ups and downs of enrollment.
Just one week into open enrollment, Donald Trump was elected President, as enrollment surged and by December’s end had broken a new record. The number of enrollees toward the end of December reached a staggering 6.4 million, 400,000 more than 2015. The presumed contributing factor to the surge in enrollees was the assumption that Trump would inevitably repeal the Affordable Care Act so consumers were racing for 2017 coverage.
However, within a week of the end of open enrollment, the Trump Administration began removing ads about Healthcare.gov, citing financial concerns particularly through radio and TV. Did this contribute to a dip in the final open enrollment figures? Perhaps. For comparison, in 2016 during the last few weeks of enrollment—with aggressive advertising still in place—687,000 people enrolled over 39 states. This year, only 376,000 people enrolled.
Around 13.3 million enrollments total were projected from the site ACASignups.net, which continuously tracks Healthcare.gov enrollment. The results instead? A little over 9.2 million (9,201,805). Of that 9.2 million, three million were new customers and 6.2 million were returning. These figures are based on Healthcare.gov’s enrollment, though individual state exchanges have not yet been tallied. Per ACAsignups.net, that figure is estimated to bring the total to 12.3-12.4 million.
Here are some highlights from the 39 states that participated in 2016-2017 open enrollment:
Top 5 Participating States By Enrollment:
Florida – 1,760,025
Texas – 1,227,290
North Carolina – 549,158
Georgia – 493,880
Pennsylvania – 426,059
Bottom 5 Participating States By Enrollment:
Hawaii – 18,938
Alaska – 19,145
North Dakota – 21,982
Wyoming – 24,826
Delaware – 27,584


