Subscribe if you want to be notified of new blog posts. You will receive an email confirming your subscription.
Trend Spotting: Are Local Care Providers Losing the Telehealth Platform Wars?

by Vince Kuraitis, JD and Randall Williams, MD
Two recent surveys shed light on the issue of patient loyalty to local care providers for telehealth visits. While the findings are mixed, local providers should be concerned about how they’re faring in the telehealth platform wars. Let’s take a look at both surveys.
Early Evidence Suggested Patients Preferred Their Own Providers for Telehealth Visits
Early evidence suggesting patient loyalty to their own providers was shown by The COVID-19 Healthcare Coalition Telehealth Impact Study Work Group. Their survey asked about telehealth encounters between March 1, 2020 and January 30, 2021 and included 2,007 respondents.
As shown in the graphic below, the findings demonstrated that a vast majority of telehealth services were taking place with “my own provider” (ranging from 71% for 18-30 year olds to 83% for those 65 or older) or “another provider in my own provider’s practice (ranging from 5 to 8%).
You’ll also note that only 1% (65 and older) to 8% (18-30 year olds) of telehealth services were from “a new provider from a telehealth provider recommended by my insurance company”.


.
The Rock Health/Stanford Study — A Shifting Pattern?
Two sets of numbers jumped out when reading the recently released Rock Health/Stanford study — Consumer Adoption of Telemedicine 2021. In 2020 and 2021, 7,980 U.S. adults were surveyed each year in the summer to fall time frame.
First, let’s look at the big picture:
The percentage of telemedicine access from “a service offered by my doctor/clinician” in 2021:
- 69% of phone calls
- 66% of live video calls
- 56% of text messages
Thus,
Over 30% of all telehealth visits are leaking away from local providers in 2021:
- 31% of phone calls
- 34% of live video calls
- 44% of text messages
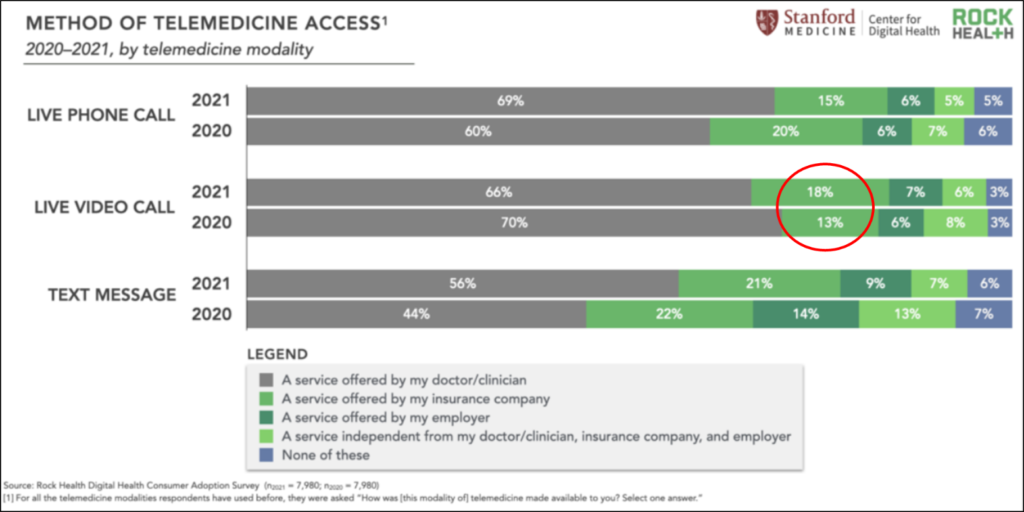
Second, between 2020 and 2021, the percentage of patients who had a live video call from “a service offered by my insurance company” increased from 13% to 18% — a 38% increase (see the red circle). This percentage increase is dramatic, perhaps documenting early successes of virtual first health plans.
Implications and Caveats
The underlying metric that both of these surveys are examining is vital to understanding who’s winning the telehealth platform wars. In essence, the survey findings examine the percentage of telehealth visits that are performed on local provider platforms vs. competing platforms. Whether you tend to “believe” the findings from one study or another, there’s no denying the importance of the metric — it’s a strong proxy for patient loyalty.
Let’s also acknowledge that it’s at least somewhat difficult to reconcile the findings of these studies. How much of the differences in the findings can be attributed to market shifts vs. methodological differences? Hard to tell. It will be critical to track changes over time.
Our Take: Despite the differences between the surveys, the big picture findings of the Rock Health/Stanford study should be deeply concerning to local care providers: over 30% of all telehealth encounters are going elsewhere. Will this trend reverse or accelerate in the post-COVID world? What actions should care providers be taking to defend their turf?
What’s your take?
This work is licensed under a Creative Commons Attribution-Share Alike 3.0 Unported License. Feel free to republish this post with attribution.