In “Contact Center Analytics – Global Market Trajectory & Analytics”, a recent report by Research and Markets, the global market for Contact Center Analytics is projected to reach US$2.6 Billion by 2027. This projection comes as a revision of the prior estimate, which was capped at US$963.7, representing a growth of more than 15% over 2020-2027 despite Covid-19.
Twilio Flex Insights (formerly Flex WFO) provides both historical and near real-time views of the performance of your Flex instance. As a built-in product of your Flex instance, Insights gives you complete operational oversight with access to omnichannel data and custom reporting at the macro and micro level.
Getting Started with Flex Insights
The scope of this blog is to cover the introductory uses of Flex Insights to get you started. Visit our Blog for more on Twilio Flex.
Flex Insights Requirements
To use Flex Insights, the following requirements must be met:
- An active Twilio Flex project
- The project must be upgraded from the Free Trial
- A Flex pricing plan must be selected
To begin, start by setting up Twilo Flex Insights on your instance. Flex Insights users must have supervisor or admin roles to access Insights’ offerings or have Workforce optimization (WFO) roles for Insights access. For more on WFO roles, visit Twilio’s guidance on leveraging identity providers to grant access to Flex Insights.
It is necessary to familiarize yourself with some basic concepts that underline how Flex Insights consumes data from your workspace. Flex Insights maps available data from events in Flex UI, Voice Recordings API, and TaskRouter to ready-for-use metrics and attributes.
Vocabulary: Conversation and Segments
A Conversation is the communication between one customer and one or more agents. By way of a common scenario, a conversation can be broken down to at least two (2) segments. The first segment, Queue Segment, starts when a customer calls in and enters a queue and ends when they leave the queue. The second segment, the Conversation Segment, begins when the customer is placed into contact with an agent. These segments get repeated in the case of a transfer where the customer is queued, speaks with an operator, is transferred, and thereby enters another Queue Segment.
Let’s jump into how to build actual reports!
Here we will cover the TWO (2) ways to generate custom reports for consuming in the Flex UI. The reports will rely on navigating and using the Analytics Portal and the Flex UI.
To access Insights reports, navigate to “Dashboards” in the left sidebar navigation on your Flex UI. The Dashboard represents a collection of reports built based on Twilio’s expertise on contact center needs. These reports, provided out of the box, are available for consumption of basic metrics and KPIs on their own or can be used as a foundation to build upon for custom reporting. Note that these reports under the “Control Center” dashboard cannot be edited.
I. Create Custom Report using an existing report:
- Navigate to the Analytics Portal and select Dashboards.
- Navigate to the available report you want to modify under the Control Center.
- Hover over the report to find “…” icon and select “View This Report” to expand the report. This will open the report in another window for viewing and editing using the metrics and attributes available under “what” and “how” respectively. Be sure to take advantage of the options available for changing the visual presentation of your report e.g. tabular data to bar chart to line chart etc.
- Once the appropriate changes have been made, click on the “Options” button and select “Save as” in the dropdown.
- Provide a name to identify the report given the changes and save in the report in “+Custom” report for ready access.
Next: Embed your new report into a Dashboard for everyday viewing.
II. Embed custom report in Dashboard for viewing in Flex:
- Return to Dashboards view on the Analytics Portal.
- Click on the gear icon on the right and select “add Dashboard” from the dropdown to open a blank dashboard.
- Click on the “Report” option in the menu bar and find the report completed in Part I.
- Edit the dashboard to include further reports, KPIs (found under Widget), or include other web content. Once complete, be sure to press Save.
- Once saved, select the gear icon again to change the access to the dashboard. By default, the dashboard is only visible to you, the editor. To allow other users to view the dashboard, select “Sharing & Permissions”.
- Provide access to individual users or select “all users in this project”. A reminder that only users with the appropriate access to Insights will have been visibility to your dashboard.
Custom reports under “Analyze” differ from reports built within Dashboards. Users with “viewer” access can only view the Dashboards as previously created. The Analyze tab is available to users with Explorer or Editor privileges and who are otherwise familiar with data analytics tools such as Power BI or Tableau.
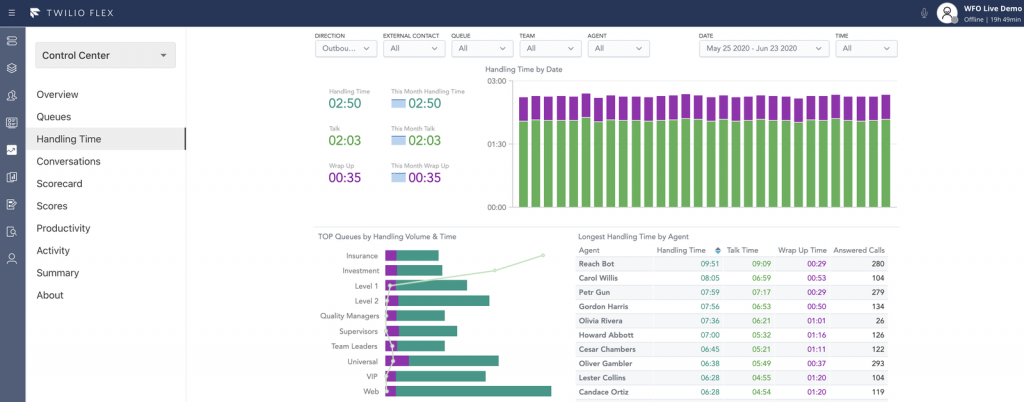
Twilio Flex Insights Dashboard View
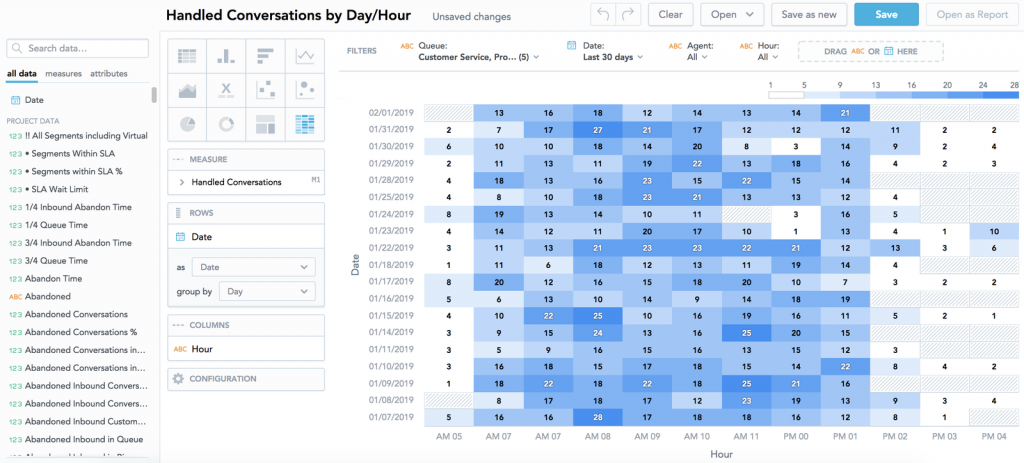
Twilio Flex Insights Analyze View – Custom Report
III. Build custom reports ad hoc:
- Select the option for “Analyze” on your Flex Instance’s side nav
- Drag and drop metrics and attributes as available on the left column
- Metrics and Attributes can be added to Measures to obtain numerical values while Attributes added to “View by” allow you to focus on the subject of your query.
- The report can be built from scratch by a data-savvy user to reflect specific insight. Reports can also use existing insights reports by navigating to “Open” and finding an existing report to build upon.
- To embed this report in a Dashboard, select “Open as Report”. under the “…” button. The report can also be extracted as an excel sheet or CSV for further review or sharing.
- Open as report will open the Analytics Portal and populate the report similar to step I.3 (under Create custom reports using existing reports) with further editing options if required.
- Follow steps I.4 and onwards to complete saving your report and embedding it into a Dashboard view.
Value-Added
According to McKinsey, companies that leveraged analytics were able to “reduce average handle time by up to 40 percent, increase self-service containment rates by 5 to 20 percent, cut employee costs by up to $5 million, and boost the conversion rate on service-to-sales calls by nearly 50 percent—all while improving customer satisfaction and employee engagement”.
Next Steps
Is your company interested in moving beyond excel reports and disjointed data? Does your current reporting provide actionable intelligence for your omnichannel contact center with real-time and historical insights? Is your reporting customizable, allowing you to drill down metrics for a specific conversation all the while listening to its recording?
We would love to discuss solutions with you to implement custom insights into your contact center and to help improve your customer experience.
Coming Soon
Please join me here again for an in-depth look at accessing Voice Recordings from within Insight’s WFO player.